If you are a statistician or a statistics student, you may know about outliers. Outliers are some unmatched values of a data set that create some problems in conclusion or result.
You should know all about the outliers in statistics, such as what are outliers, why it is important to identify them, how to detect them, and how to correct or remove them.
All these things you should be familiar with. If you are involved in statistics studies and don’t know about the outliers in statistics, it will be problematic for you after some time.
We are here to assist you if you intend to know about outliers in statistics and ways to detect or remove outliers.
This blog will cover outliers, how to identify them, why to identify them, and examples of outliers step by step. Hence continue with us to get familiar with outliers.
Let’s begin with the definition of outliers.
What are outliers in statistics?
The values that come out of overall patterns or sequences are known as outliers. Basically, outliers are data values that are significantly different from the maximum terms of the data set.
These outliers create disturbance or difficulties in the data processing and lead to wrong analysis and conclusion.
Although it is easy to identify outliers or there are different ways to identify outliers in order to get a great degree of accuracy in conclusion.
Let’s understand with a simple example if there are 10 values for analysis:2, 4, 7, 3, 5, 8, 9, 7, 8, 20. Hence we can observe 9 terms lying between 1 to 10 except 20. Hence 20 may be an outlier here.
But we are not sure here; by applying various methods or techniques, we will determine whether it is an outlier or not. But on the basis of mismatching from the other data, it can be an outlier.
How to identify Outliers in statistics?
There are 5 methods or ways to identify outliers. Let’s discuss them one by one to understand clearly.
Data Sorting
If you want to find out any unique data value within your data set, sorting the data is an easy way to do so. Sort or arrange your data either in ascending order or descending order to identify outliers easily.
A value that differs from the other value significantly can be an outlier. When you have a small data set with few or some values, it is easy to detect an outlier.
But what if it is large or you are not able to identify the outliers?
What will you do?
Don’t worry; you can use a database program to sort a large data set.
For instance, You have two data sets in one data set; values are arranged in ascending order, while in the other, values are sorted in descending order. We have to identify outliers in these data sets.
2, 4, 5, 7, 8, 64
78, 67, 66, 61, 58, 3
In the above case, 64 is highly larger than the other values, and in the below case, 3 is much smaller than the rest of the numbers. Hence 64 and 3 can be assumed as outliers.
Use charts and graphs
By representing data visually with the help of charts and graphs can be helpful in order to identify outliers in your dataset. Use graphs such as scatter plots, histograms to detect unusual values in your data set.
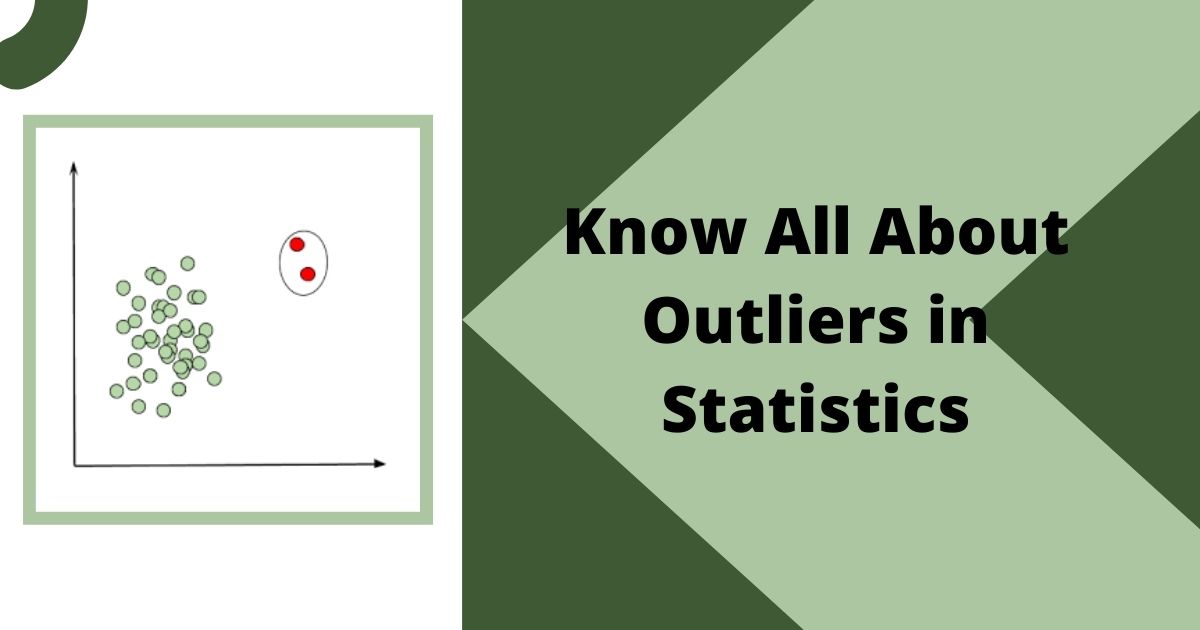
In a scatter plot, data is represented with the help of points and dots according to the x-axis and y-axis. Hence you can identify an outlier by checking which dot or point is lying far away from the other points.
On the other hand, the histogram shows the data in bins(groups). Here your data is represented either on the right side and left side.
Suppose your mostly data is lying on the right side and less data is displaying on the left side; we can say that the left bin is an outlier.
Z-score calculation
By calculating the z-score or standard score, you can determine how far away a data point is from the mean of data. For the evaluation of the z-score, you need to minus the mean from the raw measurement and divide it by the standard deviation.
z-score = raw measurement-mean/standard deviation
The formula for z-score is
z= (x-μ)➗σ
Here
x is the raw measurement
μ is the mean
σ is used for the standard deviation
For a data sequence, the z-score of each data point should be near 0, if it is far from the 0 value, it means that the data point is an outlier.
Suppose the z-score for your data points are -0.25, -0.18, -0.23, -0.34, 5.8; here, the data point with a 5.8 z-score is clearly an outlier as it is far away from 0.
Determine Interquartile Range
Here we use first and third quartile marks to measure the IQR(Interquartile Range) as we have to minus the first quartile from the third quartile.
IQR = Q3 -Q1
Here Q3 is the third quartile which is equal to the median of the upper half of the data set.
Q1 is the first quartile which is equal to the median of the lower half of the data set.
We determine the interquartile range to find out the dispersion of data points between Q1 andQ3. When the IQR of a data point is over 1.5 times the IQR below the Q1 or 1.5 times the IQR above the third quartile, you should know the percentile of Q1 and Q3 to evaluate IQR.
Equations for identifying outliers.
High outlier ≥ Q3+(1.5 * IQR)
Low outlier ≤ Q1 -(1.5 * IQR)
Hypothesis test
The hypothesis test is an advanced way to detect outliers such as generalized ESD, Peirce’s Criterion, Grubbs’ test. These tests use data processing through equations in order to check if it matches the predicted results to identify outliers.
Conclusion
In this blog we have discussed the outliers in statistics and ways to measure those outliers. We need to identify these outliers to avoid any error in our calculations and result. The outliers may cause unwanted results and useless conclusions.
Moreover, the descriptive statistics is sensitive to outliers, hence it becomes important for us to detect such outliers. I hope now you are familiar with the term outliers and what they cause, how to identify them etc.